As you may have heard, last week Texas OnCourse released DataDive, a new tool that organizes Texas academic data into easy-to-read graphics so that you can access the info you need to address your campus or district needs. As a counselor, this tool helps me find the data I’m looking for in order to advance the success of my students and district.
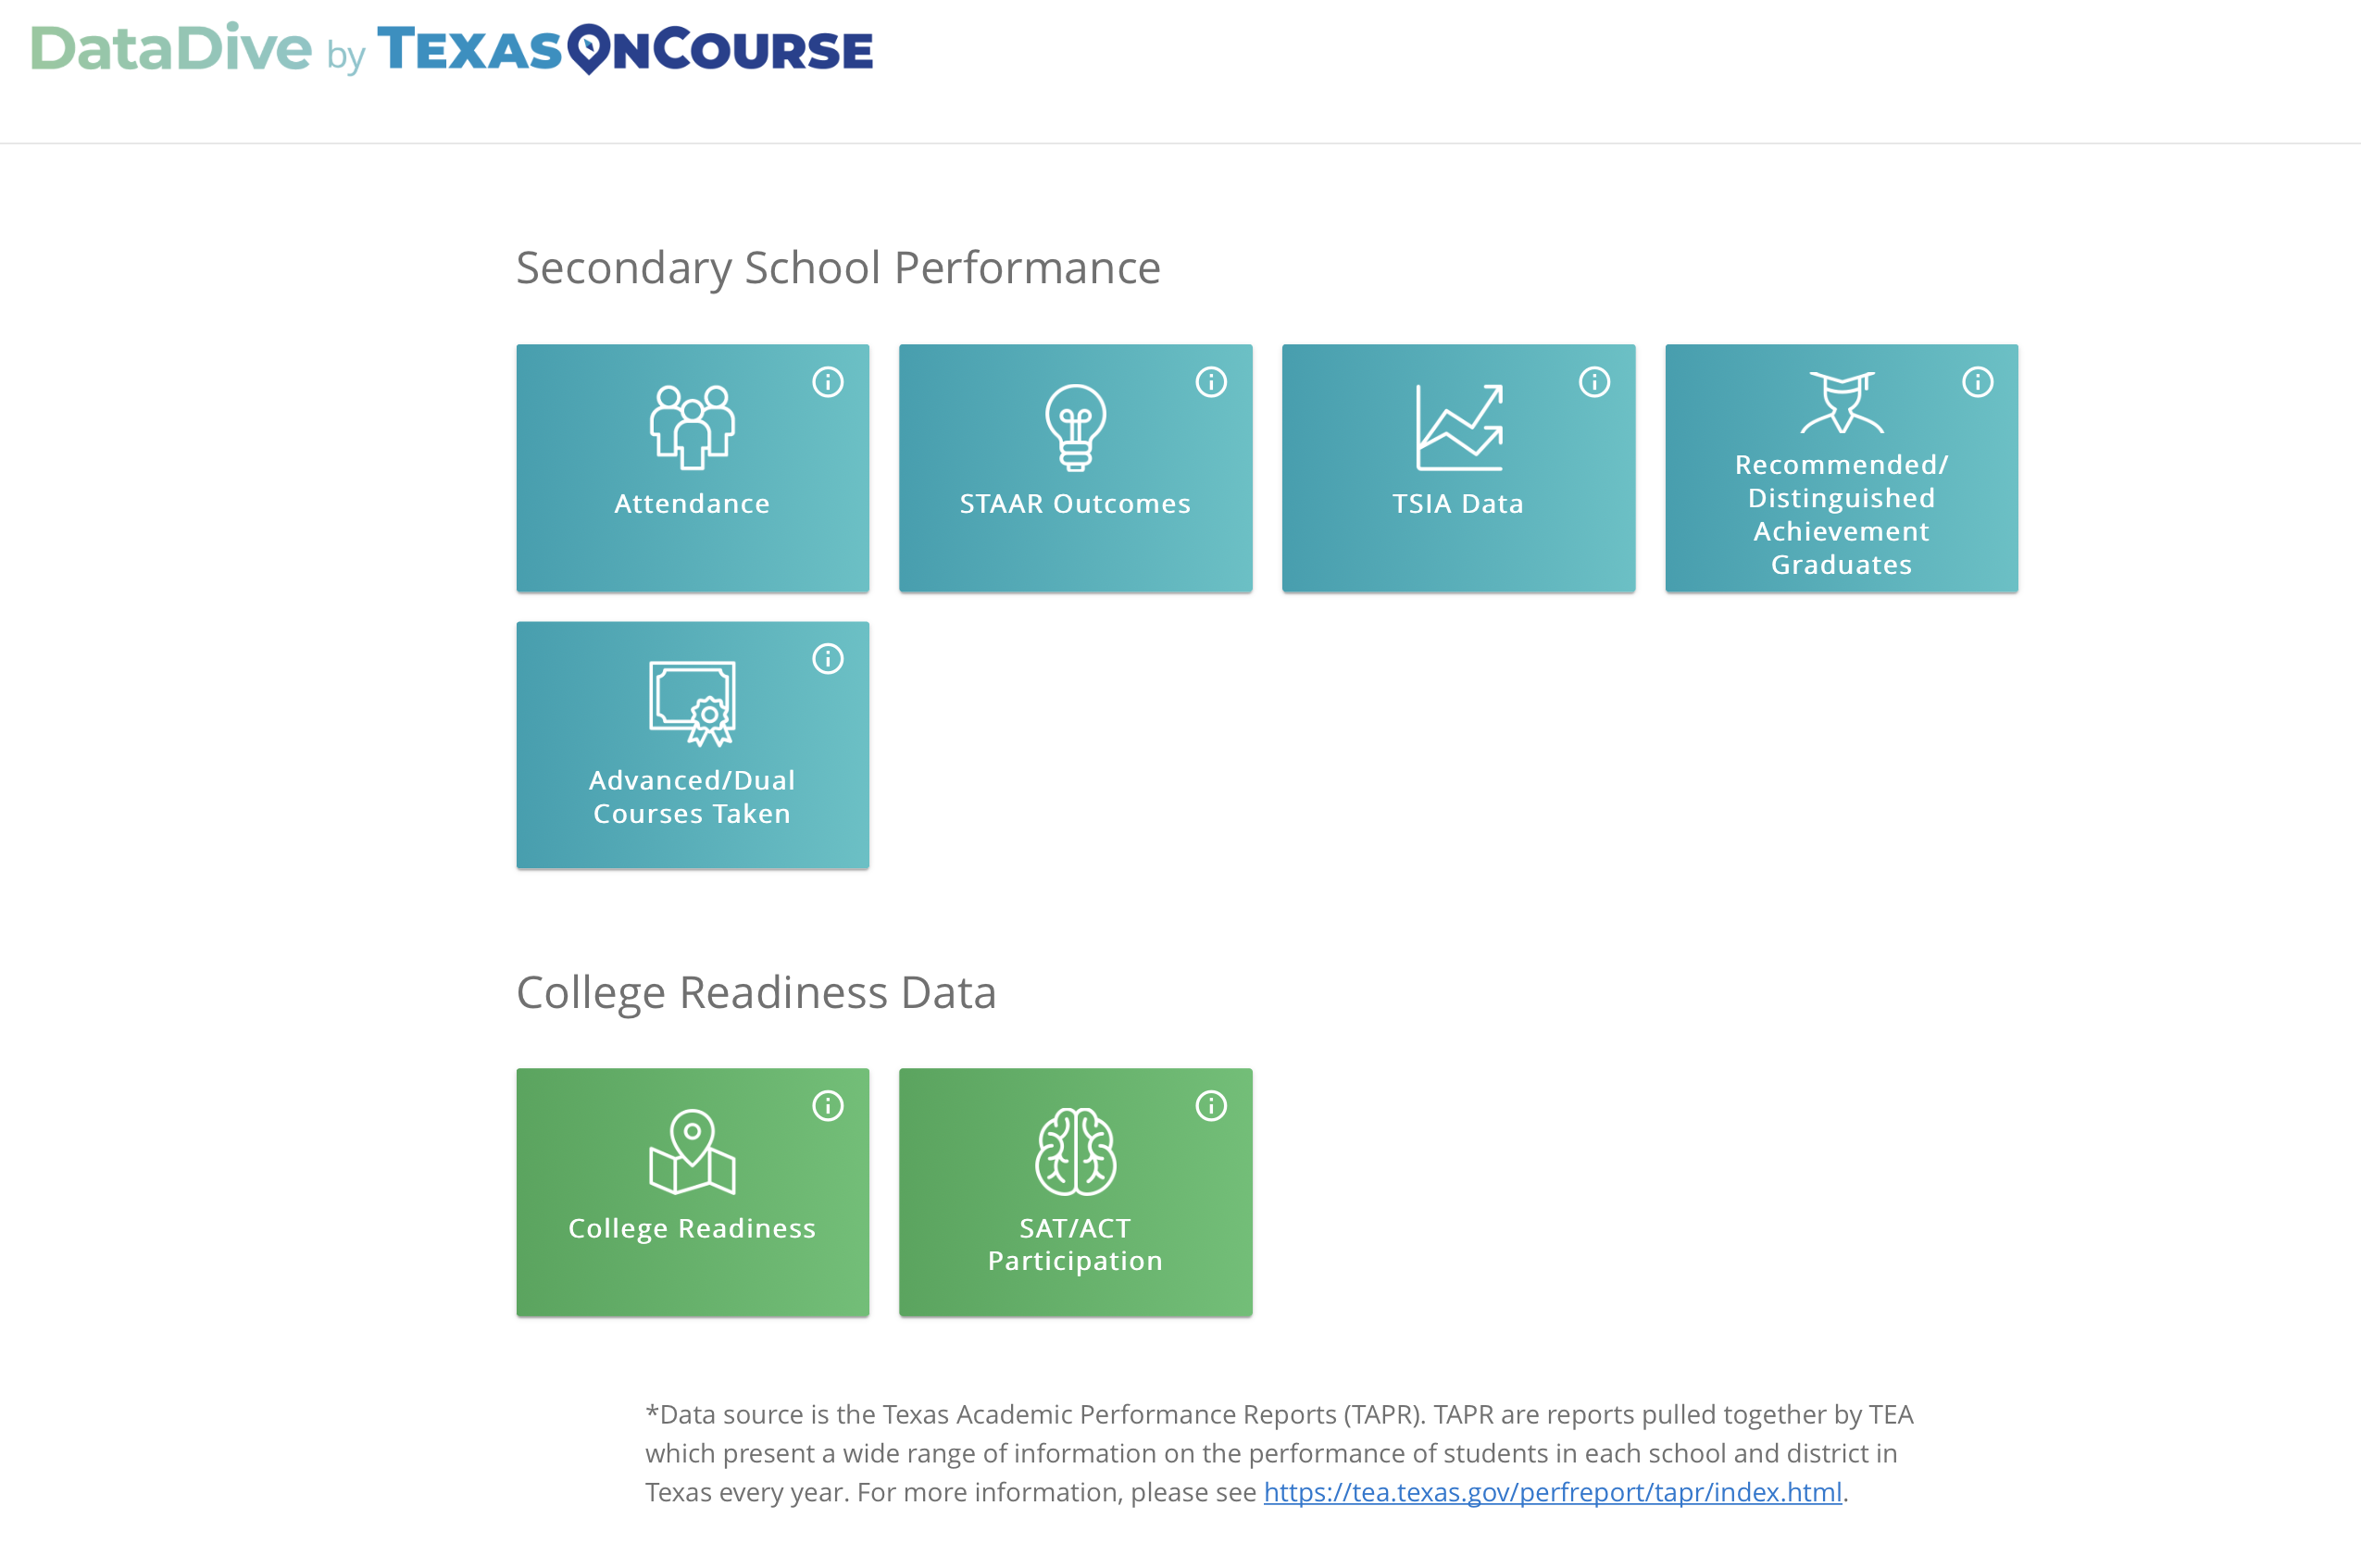
The data in DataDive is derived from the Texas Education Agency’s Texas Academic Performance Reports (TAPR). DataDive takes this data, normally available in spreadsheets, and makes it easier for educators to compare each strand of data to other campuses, districts, or ESC’s. Breaking down this information enables a campus or district to target the areas necessary to further student success.
As a Texas OnCourse Leader Fellow, I’ve spent some time this past week exploring the tool, and I want to share with you some helpful how-to’s for generating reports and reviewing data.

Leader Fellow Kyla Kenworthy
Let’s say you wanted to compare a breakdown of TSIA completion rates on a state level and an ESC/region level. Start be selecting the highest level* you want to view - in this case, the state:
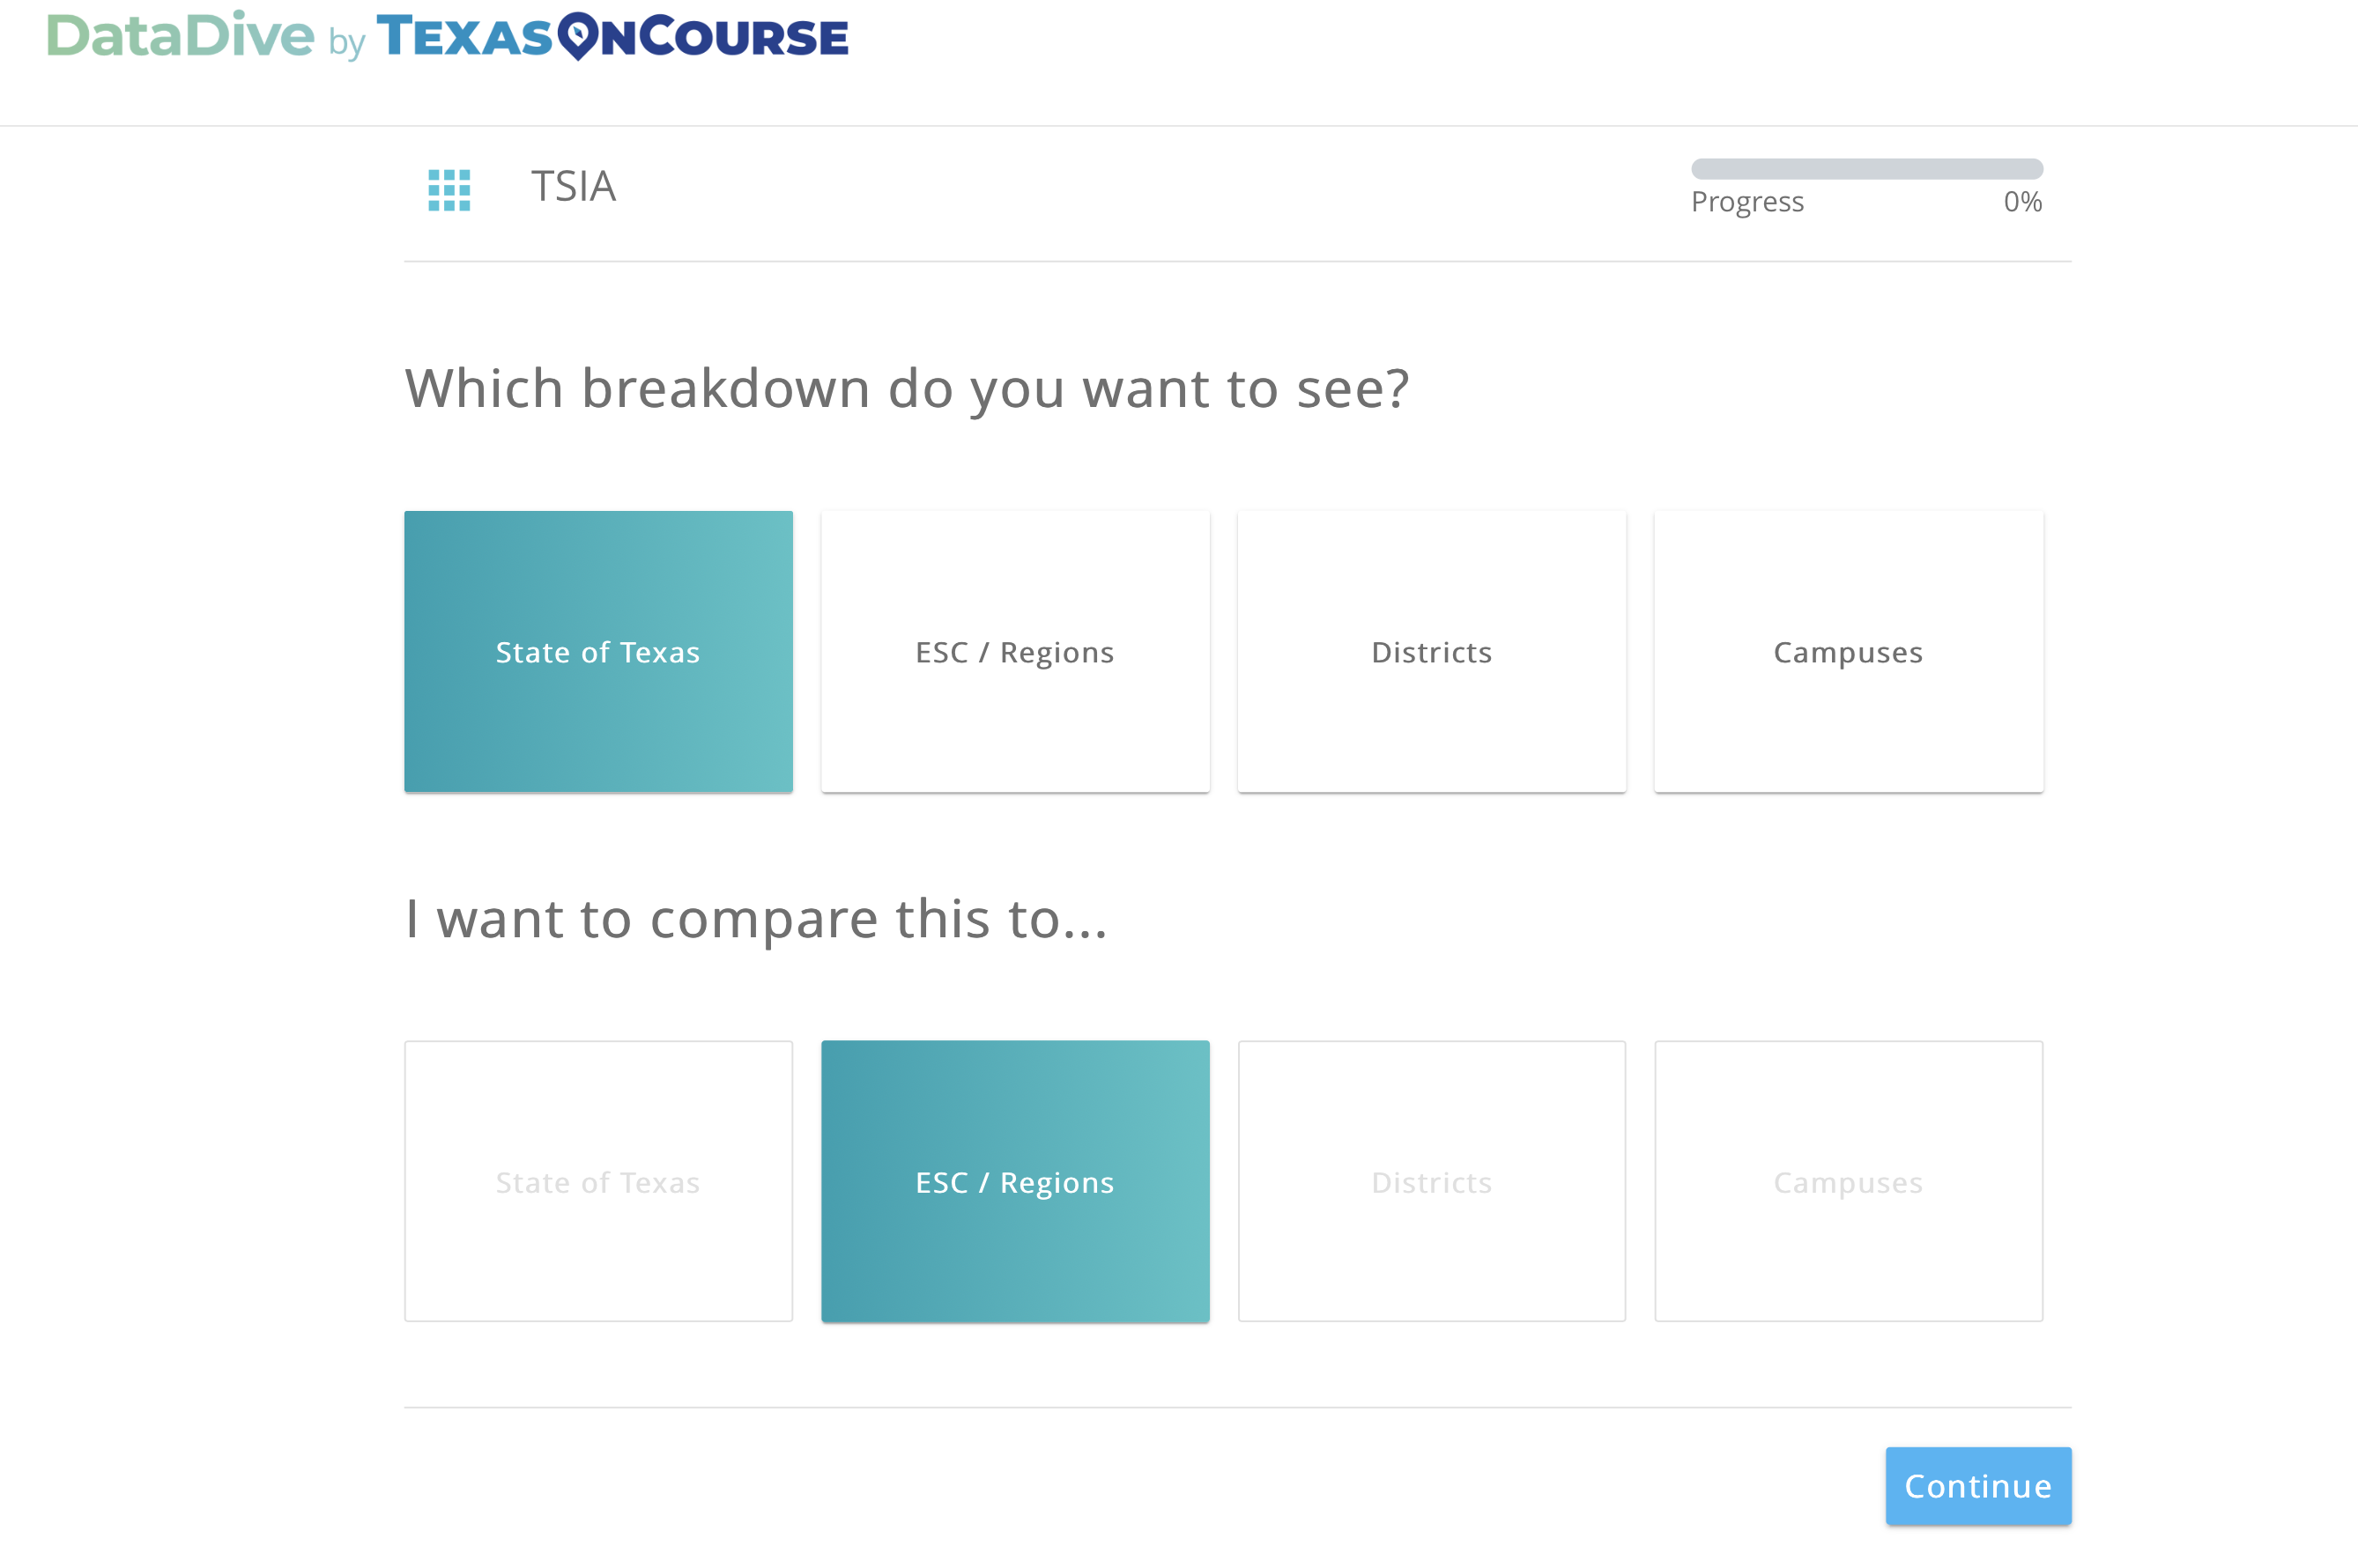
*Helpful hint: if you want to view or compare campus-level data, always select the associated district first. This filters the campuses in that district and makes finding campus names so much easier!
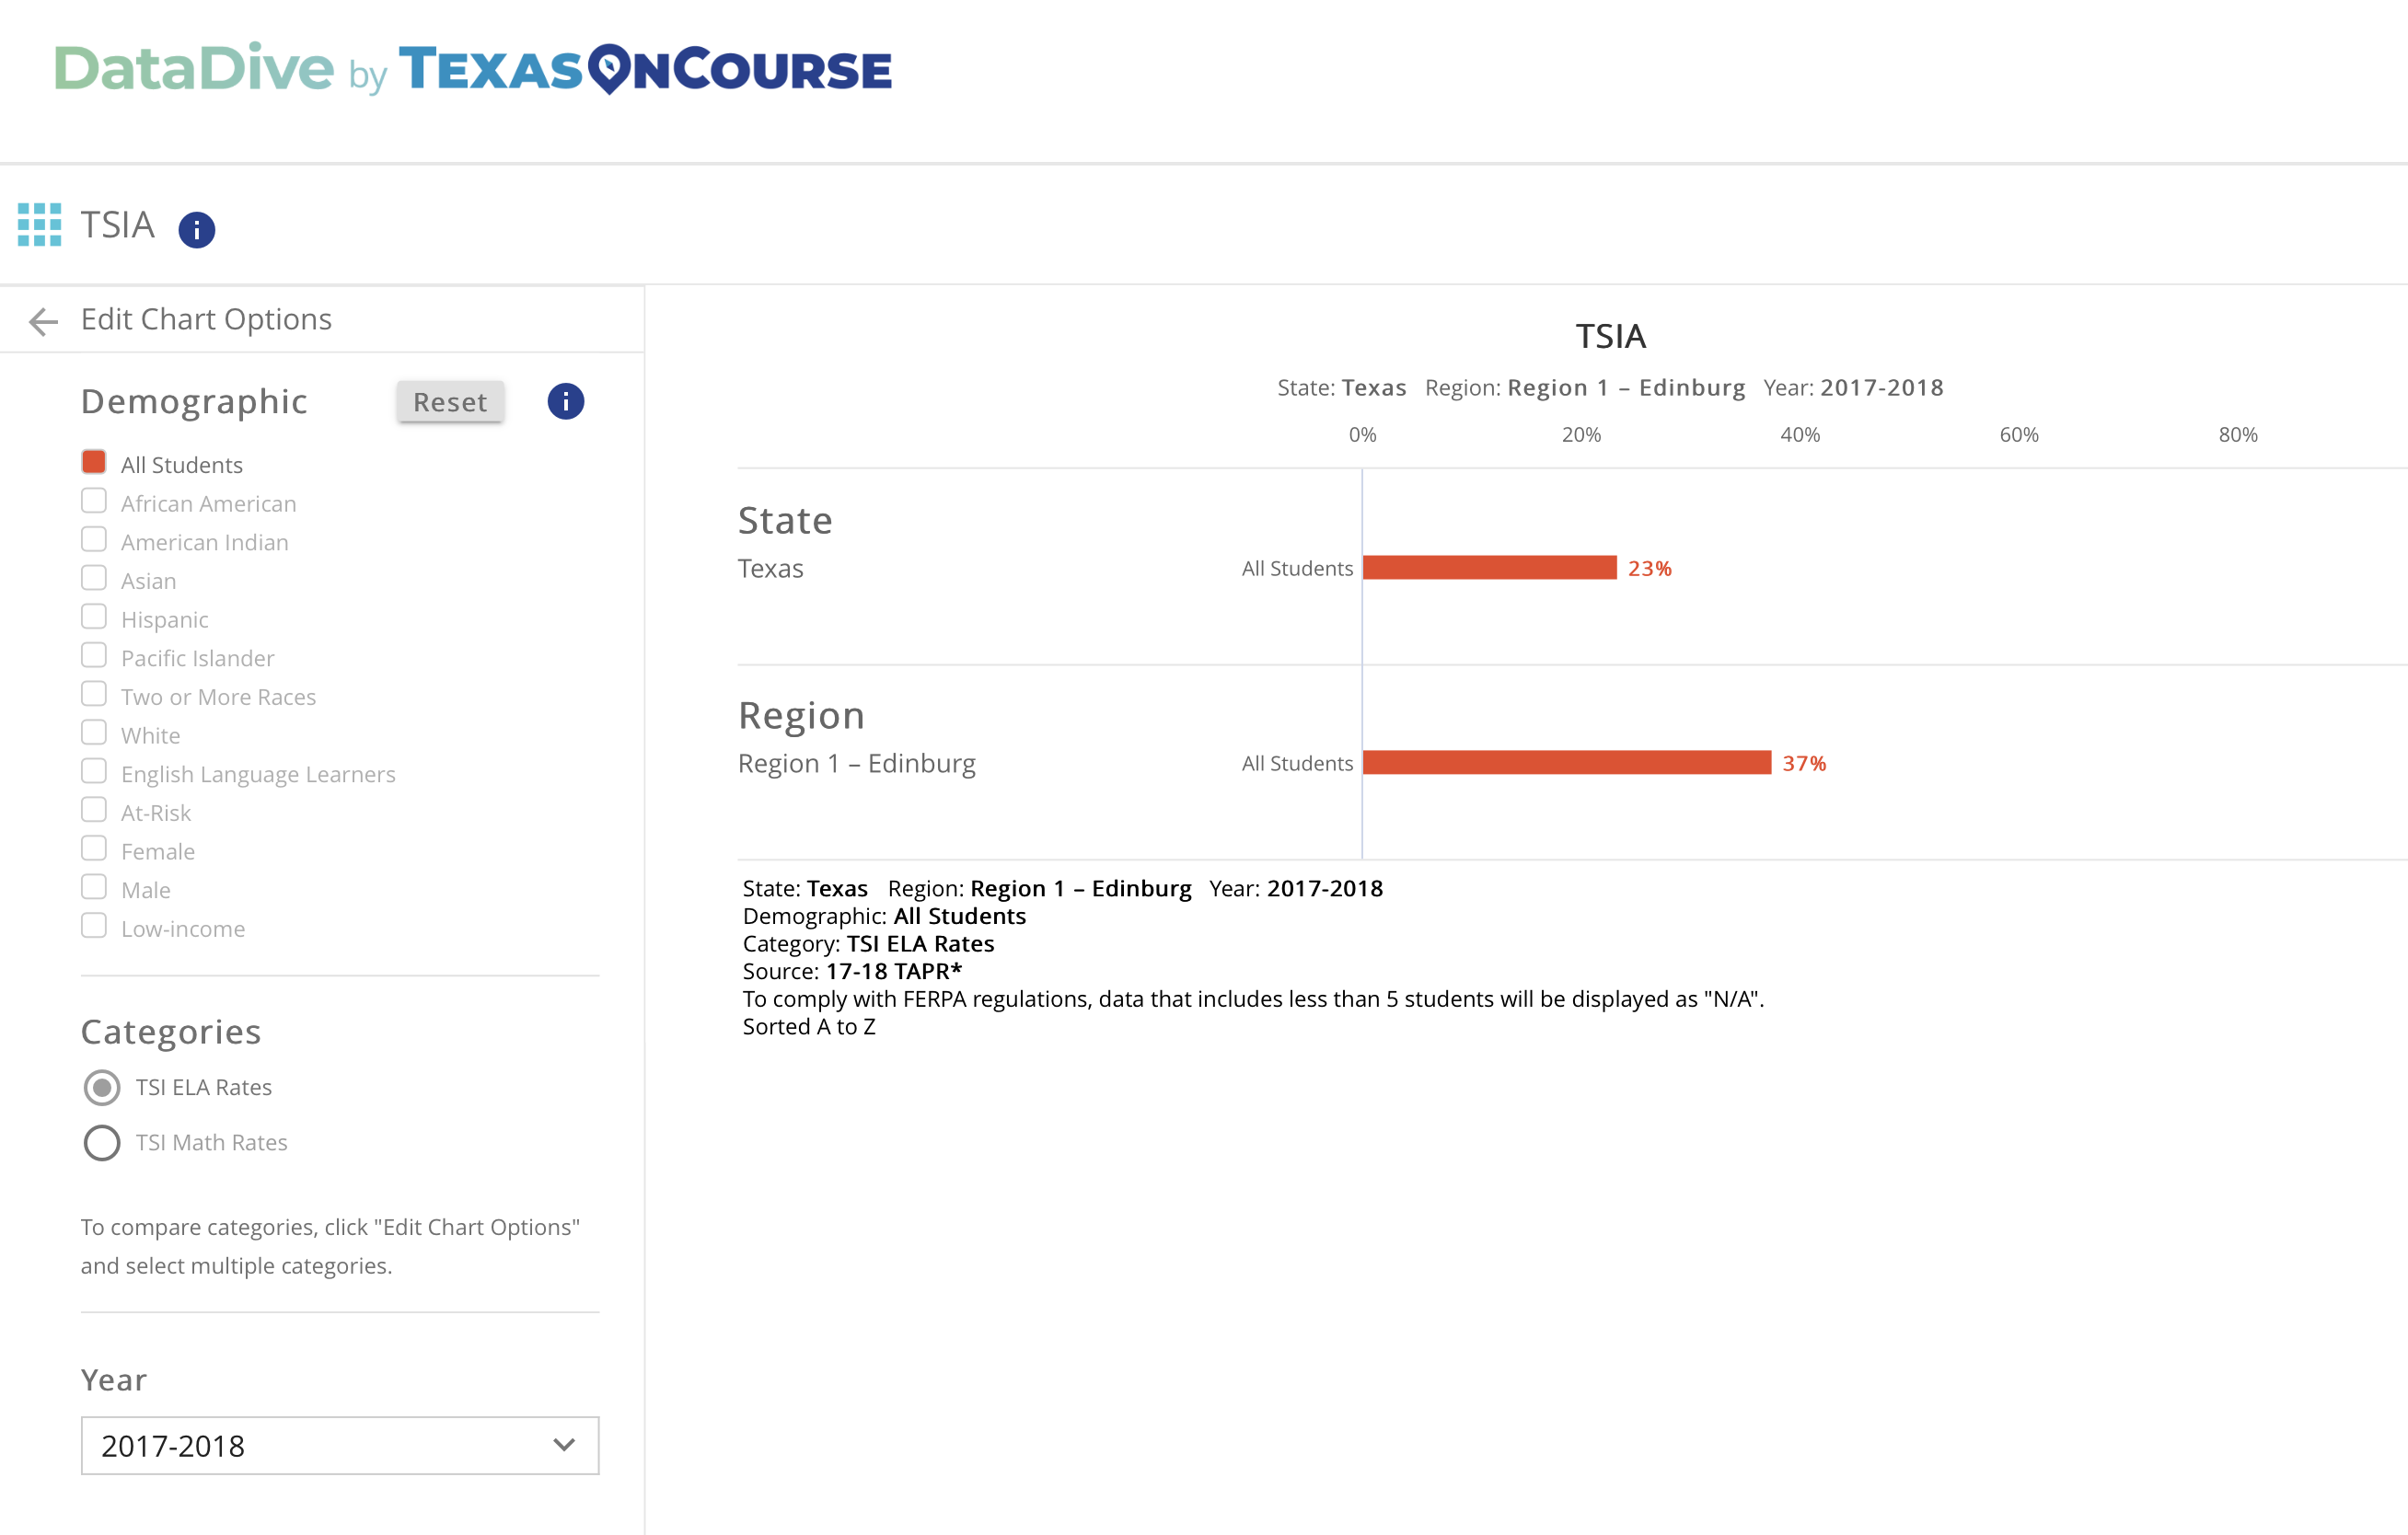
For the purposes of this demonstration, we’ll select Region 1 - Edinburg. We’ll also choose to specifically view TSI ELA completion rates:
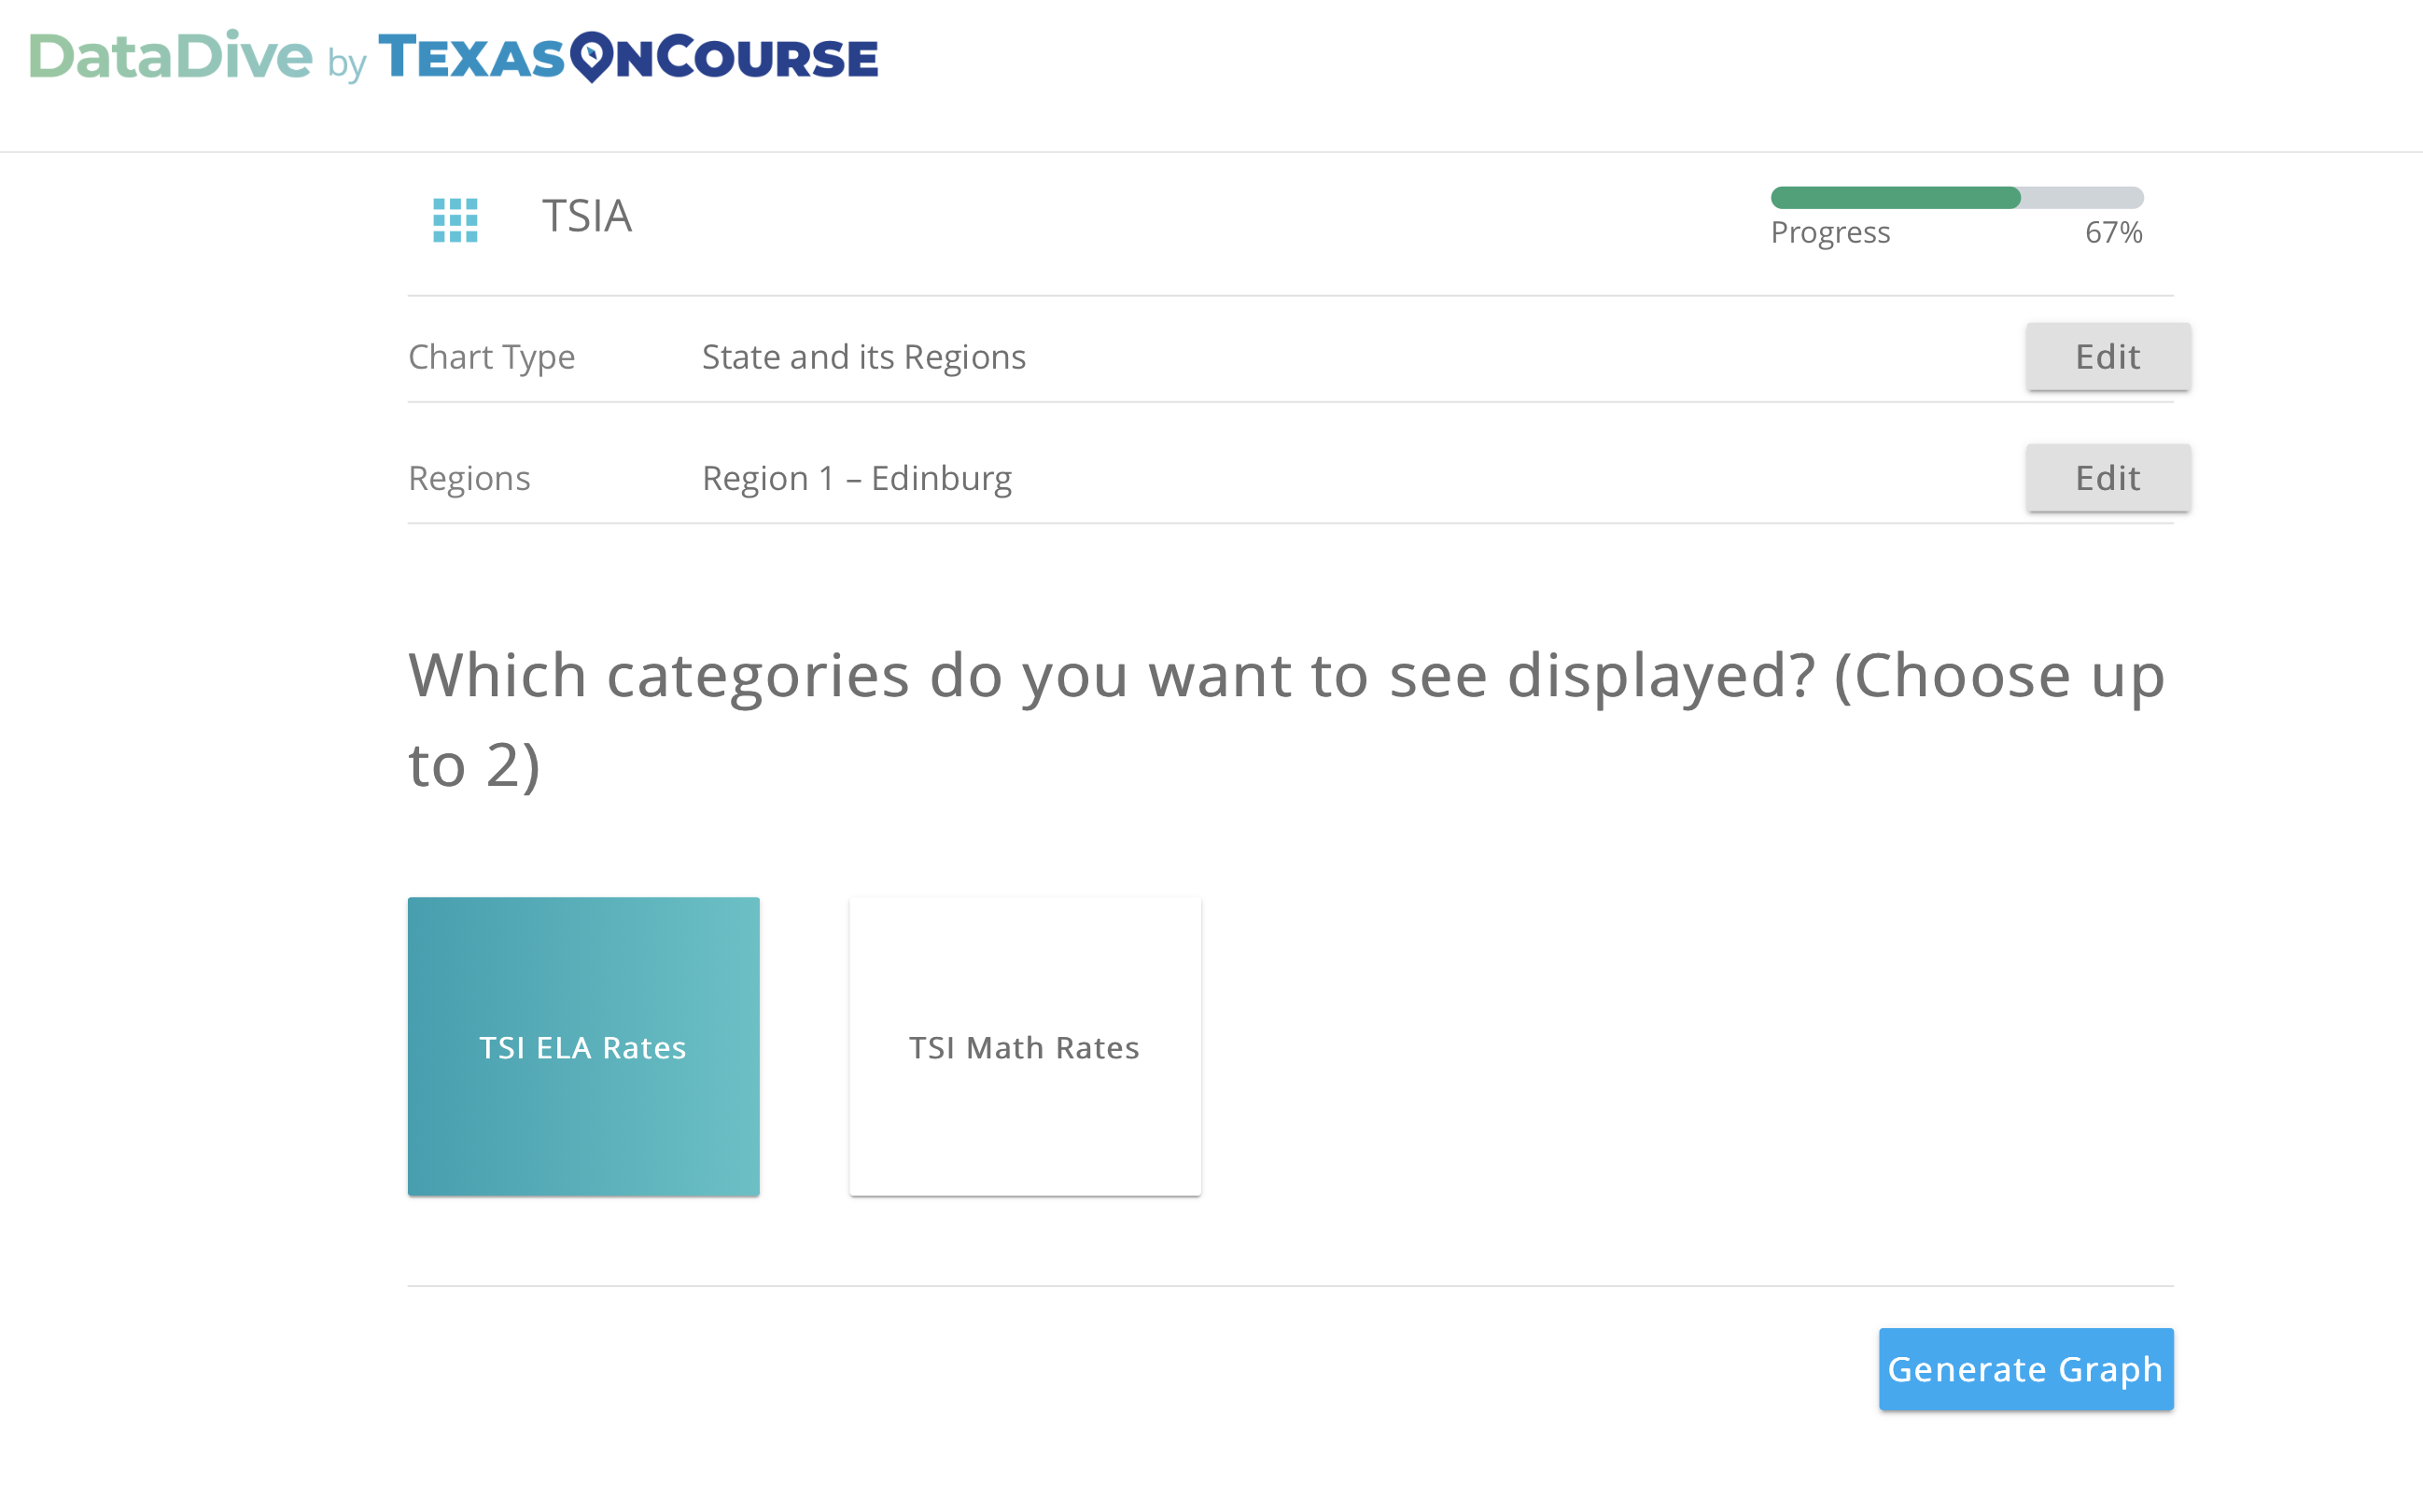
After you click “generate graph,” you’ll see how Region 1 TSI ELA rates compare with TSI ELA rates on a state level. It’s just that easy!From there, you can also break data down by demographic category if you’d like.
 It’s the opportunity you don’t want to miss.
What happens if you don’t use DataDive? Well, nothing. You keep getting what you’ve always gotten, which probably means you spend much too much time figuring out the trends in your own TAPR reports. I hope that DataDive makes it easier than ever to connect with state data and pinpoint the needs of your students.
See for yourself what DataDive can do for you and your students.